Members: Jun Okumura, Dai Mineyama, Hiroko Watanabe, Kenichi Otsuji, Takuma Matsumoto, Tahei Nakamura, Seichiro Aoki, Eiji Asano, and Kazunari Shibata
This is the summary of my work done in 2008. We developed a code to make three dimensional movies of the solar corona based on IDL (Interactive Data Language).
Contents
Kyoto University Museum Academic Film Competition Award Ceremony
How to make 3D solar Movies
1. Preparation of data
2. Rotating solar images to make images line up at exactly the same interval
Presentation Files
Code
Kyoto University Museum Academic Film Competition Award Ceremony
We were awarded for making useful movies in Kyoto University Museum Academic Film Competition 2009.
How to make 3D solar Movies
Here we report a method to map the 3D structure of the corona, using complete soft X-ray images of the Sun taken with Yohkoh/SXT and Hinode/XRT. Our method utilizes two of these images which were taken 7 hours apart, with the assumption that the coronal structure does not change much during this time. This assumption is satisfied for the global coronal structure such as large scale coronal loops in active regions and quiet Sun as well as coronal hole structure. Using this method, we made 3D movies of the corona observed by Yohkoh and Hinode. With this movie, we can see the 3D structure and associated dynamical activity of the Sun more intuitively.
Though these 3D movies were prepared for public to explain about the dynamic solar activity observed with X-ray telescopes, I believe that these movies will also help researchers to understand coronal activity more intuitively. Actually our method is to make a pseudo-three dimensional movie, whereas satellite such like STEREO is taking “accurate” stereoscopic images of the Sun. However,
the advantage of our method is we can create a 3D movie using only the data of a single satellite.
1. Preparation of data
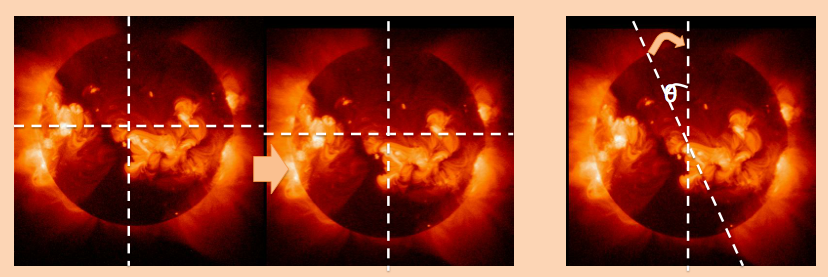
First of all, we need the observed center-fixed and axis-fixed images (here, we do not take B-angle into account).
Lining up these images after the corrections, we can make a solar movie. The difficulty is that these prepared images are not all taken at the same interval, so the movie will not be smooth.
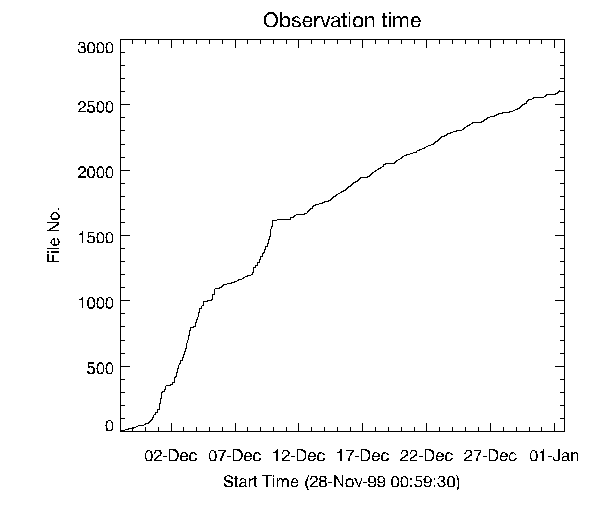
an example of the observation time and the corresponding cumulative distribution of file number. As you can see, time interval depends on the observation date.
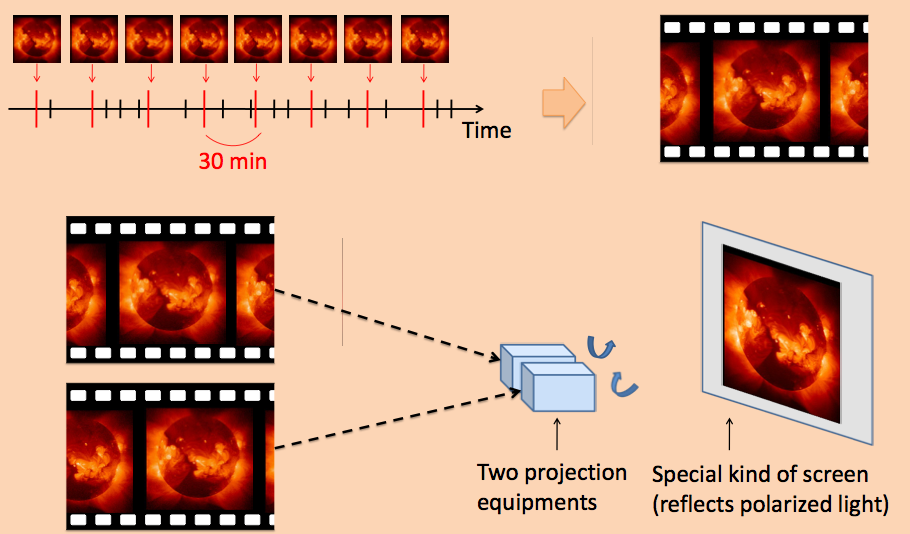
Then we have to select the images, lining them up at approximately the same interval. Here, we used 30 minutes as the time interval and, selected the data as shown below.
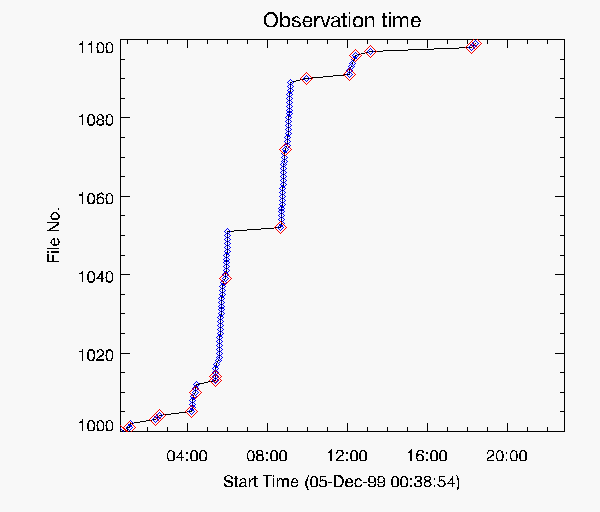
An example of the selection. Vertical axis indicates the cumulative file number, and the corresponding observation time is indicated by the horizontal axis.
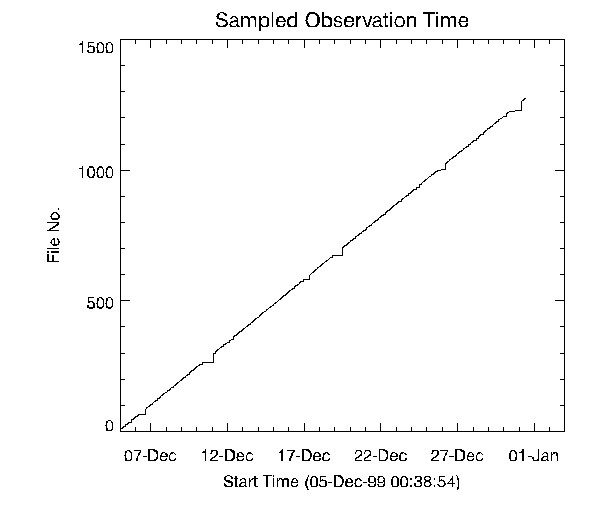
The file number against observation time after selection. In spite of this file selection, the data still has not been smoothly lined up
2. Rotating solar images to make images line up at exactly the same interval
we finally could get the images line up in approximately the same interval (here, 30 minutes). These images, however, do not have the exact same interval. Therefore, for the purpose of interpolation, we utilized 14 images, 7 images before and 7 images after, around the selected images. We merge these 14 images and made the images line up at exactly 30 minute intervals.
Here, we have to note that these 14 images are taken at different time, and simply merging these different images can be somewhat dangerous (The sun is rotating during observation.)
To avoid this inaccuracy, we made two modification.
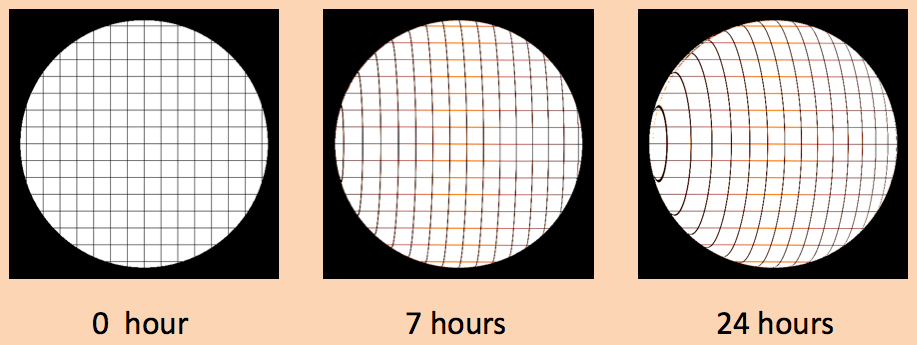
(a)Rotating the solar image according to how long between the time the image was taken and the time of the image we need to correct.
To rotate the images, we calculated how many pixels the solar image must be moved to create an image at the correct time (indicated as Δ in the figure).
The value Δ can be calculated in the expression below.
This time, we utilized the rigid body rotation model rotating in 27.5 days. We can also take the differential rotation of the solar corona into account, and both models seem to have no apparent difference.
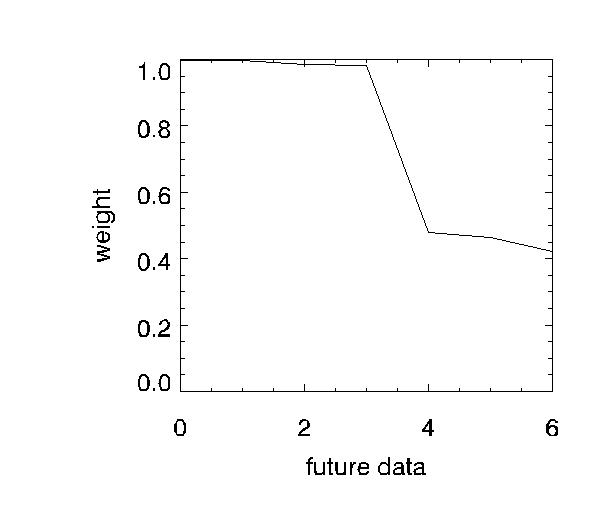
(b) Adding a weight, namely utilizing data that is closer to the time we want to make the image more than data that is farther away.
Figure below is an example of the weight. Here, we estimated the weight according to how long before or after the required time
the images were taken. Then we do not have to worry about the inaccuracy that arises from the difference in observation time during taking 14 images.
Finally we can get the images lining up at exactly 30 minute intervals, and make a smooth movie. Then showing two movies with a several hour separation can be used in three dimensional visualization system, by using two projectors simultaneously.
Presentation files:
| Date | Conference | Place | files |
| 2008 June 17 | AOGS(Asia Oceania Geosciences Society) 2008 | Busan, Korea | |
| 2008 October 9 | Flux Emergence Workshop 2008 | Kyoto, Japan | PPT file 11.7MB |
| 2008 November | IGY+50 Modern Information Technologies and Earth and Solar Sciences | Tsukuba, Japan | PDF file 2.3MB |
Code
| explanation | file |
| IDL procedure for making movie of Yohkoh/SXT | IDL procedure (7.4KB) |
| IDL procedure for making movie of Hinode/XRT | IDL procedure (12.1KB) |
| color table | txt file (9.9KB) |

